Thursday, August 4, 2016

Chicago River Lab

3 Things I Learned in this Lab:

  1. Chicago has 37 moveable bridges. 
  2. The Michigan Avenue bridge is a double-lear, double deck bascule trunnion bridge. 
  3. Chicago bridges are painted red to recreate the original paint color, which was red lead paint (to prevent rusting) mixed with black powder (to tone down the red). 
2 Things I Found Surprising in this Lab: 
  1. I was surprised that the Chicago River was so clean according to all of our tests; I've grown up in Chicago and have been told by my whole family to never swim in the river or even go too close to it for fear of pollution. However, the tests we performed in this lab disproved their theories of its severe pollution. 
  2. I was surprised that the bridge requires so little energy to be moved. In the museum, a sign said that the amount of energy needed to lift the bridge is the amount of energy in a 1950s Volkswagen Bug motor. 
1 Question I Have After This Lab:
  1. Who/what else was affected by the River's pollution before the flow was reversed? Because of the amount of pollution and untreated sewage that went into Lake Michigan, which is so large and connects so many places, what other places or people were affected?
The test I did was of the Chicago River's pH. This test measures the concentration of hydrogen atoms and the acidity of a fluid. This is important because too much or too little acid in a river can be dangerous for the environment in and around the river. We took a sample of river water, placed a pH testing fluid in, waited for the water to change color, and then matched that color to one on a chart to see what the pH was. 

Based off of the Q values found in class, we can classify the river's quality as excellent. However, we were so close to the lake that our results might have been tainted by the low percentage of actual river water. However, this could be improved if fewer things are put into the river; for example, runoff from chemicals often gets into the river and pollutes it. I personally can work to reduce the number of chemicals I use in my life (in hair products, soap, food, etc.) to cut down on the number of chemicals that could potentially enter the environment. 

Lab 14: Titration


Titration setup
Analyte at equivalence point
For our procedure, we used NaOH, vinegar, and phenolphthalein to identify the percent ionization of vinegar. We first obtained a burette and primed it with NaOH to clean and prepare it. Next, we filled the burette to 50 milliliters of NaOH. We then filled an Erlenmeyer flask with 7.0 milliliters of vinegar, 20 milliliters of water, and 4 drops of phenolphthalein. We then measured drops of NaOH into the Erlenmeyer flask until the solution turned barely pink, which was the point of equivalence of the vinegar. We did this twice and measured that it took 22.30 milliliters to turn the substance pink the first time and  22.10 milliliters the second time.

The percent ionization of the vinegar is .489%. This is so low because vinegar only has 1 ionizable proton (Hydrogen), which makes the possibility of it ionizing very, very small.

Monday, August 1, 2016

Lab 17: Calories in Food


In this lab, we measured the Calories in certain food by burning the food and then measuring how much heat the food let off by boiling water. The amount of heat that the water gained was the amount of water that the food lost, which allowed us to then calculate how many calories the food had.


Lab 16: Specific Heat of a Metal

Our setup


Lab 16: Specific Heat of a Metal
For this lab, we were provided with an unidentified metal. To identify this metal, we heated it in a beaker of water and used the changes in the water temperature to identify the heat that the water gained and use the opposite as the energy that the metal lost to find the metal's specific heat. Once we calculated how much energy the metal lost, we found its mass and its temperature change. The specific heat we calculated was 0.17 g/jC, which would make our metal iron.


Saturday, July 30, 2016

Lab 15: Evaporation and Intermolecular Attractions


Substance
Initial Temperature 
(Degrees Celsius)
Final Temperature
(Degrees Celsius)
Change In Temperature
(Degrees Celsius)
Methanol
21.1
6.5
-14.6
Ethanol
19.8
11.3
-8.5
n-Butanol
20.9
18.7
-2.2
Glycerin
21.3
24.4
+3.1
Water
20.7
16.7
-4.0

2) The substance with the largest difference in temperature was methanol. This was because methanol has the fewest places for intermolecular hydrogen bonding to occur, so it was easier to break apart and evaporate, causing the greatest temperature change.

3) Methanol and ethanol have similar molecular masses but had different evaporations. Methanol had a temperature change of -14.6 degrees Celsius and ethanol had a temperature change of -8.5 degrees Celsius. This is because methanol has fewer possible intermolecular hydrogen bonds, so it's an easier substance to break apart than ethanol, which has more places for possible intermolecular hydrogen bonds to occur.

4) All of the compounds in these substances are formed through hydrogen bonds and these specific molecules bond together through bonds between oxygen and hydrogen atoms. Therefore, the more oxygen and hydrogen atoms a molecule of these substances has, the less likely one of these substances is to break apart. For example, methanol has the fewest number of hydrogen and oxygen atoms and n-Butanol has the most, which corresponds to the fact that methanol evaporated the fastest and n-Butanol the slowest.

Wednesday, July 27, 2016

Lab 11: Flame Test Lab


In this experiment, we used a bunsen burner to ignite different chemical solutions that had been soaking onto a wooden splint. The ignition of these solutions created many different colored flames which we observed.


For the last part of the lab, we identified the unknown substances based off of the data we had collected about the known substances. For unknown solution one we identified it as Strontium Chloride. When we burned the substance, it gave off very red light. We knew that it was either SrCl2 or LiCl because both of those gave off red light; however, LiCl gave off orange light in addition to red light and the unknown substance gave off solely red light, which allowed us to determine the true identity of the substance. Unknown substance two gave off a purple light. The only solution that gave off a purple light in our experiment was Potassium Chloride, so we knew that the unknown substance had to be Potassium Chloride, or KCl.


Tuesday, July 26, 2016

Lab 12: Electron Configuration Battleship


The hardest thing about playing this game was starting it off; I was still confused about how exactly to name the electrons and I was intimidated to have to state the configurations in a pressuring game scenario. However, I used my reference packet and labeled periodic table and it proved to be easy enough to name them once I got started. Through this activity, I became much more confident in my abilities to identify an electron through off of its configuration.

My battleship configuration is on the bottom and my partner's is on the top. My partner sunk two of my ships (the ones with green xs) and I sunk two of his, including his battleship (the ones highlighted in green on top). 

Monday, July 25, 2016

Lab 10: Mole-Mass Relationships Lab

          The purpose of this lab was to determine the relationships between the compounds in a specific chemical formula, determine the "restricting" reactant, and to find the theoretical yield of this chemical formula.


           My percent yield did not add up to 100%, but instead added up to 122%. This could be because Evan and I added too much acid while mixing the hydrochloric acid and sodium bicarbonate or because we used too much water to clean off the watch glass, which then got added back into the product's mass. 


Sunday, July 24, 2016

Lab 9: Composition of a Copper Sulfate Hydrate Lab


Before heating the hydrate
After heating the hydrate
Data
Mass of Evaporating Dish - 25.40 grams
Mass of Evaporating Dish + Hydrate - 26.88 grams
Mass of Evaporating Dish + Anhydrous Salt - 44.1 grams (1st heating) 
Mass of Evaporating Dish + Anhydrous Salt - 43.7 grams (2nd heating)
Mass of Evaporating Dish + Anhydrous Salt - 43.74 grams (3rd heating)


          Since our percent error was so high, it is likely that our actual empirical formula would be different. I predict that there would actually be more copper sulfate molecules per water molecule in the empirical formula. I believe that our results had such a high percent error because we incorrectly massed the evaporating dish at the beginning of the experiment, leading to incorrect results the rest of the way through the experiment. This may have been because the scale was tared and we did not realize it or for another reason, but looking at the data, the evaporating dish should have logically massed almost twice as much as we had previously found. 


Saturday, July 23, 2016

Lab 8: Mole Baggie Lab


Bag A6
          The purpose of this lab was to identify the contents of a bag using the bags mass and the number of moles of the compound in the bag. We were given the mass of the empty bag, a list of possibilities of what substance could be in the baggie, and the number of moles, and we massed the bag once we received it. 

          We learned that bag A6 was filled with sodium sulfide

          We learned that bag B2 was filled with sodium chloride

          To identify the compound, we first massed the baggie and subtracted the weight of its container (the baggie) which we had been given. Next, we took that number (the mass of the compound) and divided it by the number of the moles that were in the bag (information we had been given). The number that calculation produced was the atomic mass of the substance. Then, we calculated the atomic masses of the compounds that were provided for us as possibilities by finding their elemental components and proportionally adding up each one's atomic mass to get the compound's atomic mass. We then compared the unidentified compound's atomic mass to the atomic masses of the identified compounds and found that bag A6's atomic mass was most similar to sodium sulfide's atomic mass and bag B2's atomic mass was most similar to sodium chloride's atomic mass. 


Friday, July 22, 2016

Lab 6: Double Replacement Reaction Lab


The solutions in white wells
The solutions in clear wells
Question #2
Question #3

The most challenging part of this lab was balancing the equations once the lab was over. Many of them were very complicated and intricate, and it took me a lot of time to solve and balance them and check over my work.

Wednesday, July 20, 2016

Lab 5: Nomenclature Puzzle

Lab 5: Nomenclature Puzzle

The finished puzzle
The purpose of this lab was to practice using nomenclature through matching chemical formulas to their chemical names.

The biggest challenge of this activity was placing the groups my partner and I had matched into the entire puzzle. We started by making pairs and then moved onto fitting those pairs into the entire puzzle. After we'd made all of the small groups we could have possibly made, we then moved onto forming the entire puzzle. This was where we faced the hardest part of this lab, which was making already existing pieces into even bigger pieces. It was hard and time-consuming to look through all of the pieces to find where the next group would fit. Also, we ran into problems here because if we calculated inaccurately, we'd waste time looking for a non-existent puzzle piece. However, we persevered and finished the puzzle. I would not change this method, the only thing I would change would be how long I spent identifying which pieces needed to be found in order to determine what exactly we needed to be searching for. 

I believe the biggest contribution I made to the lab was my leadership. In this lab, I worked hard to try and lead the group to what steps we needed to take in order to solve the puzzle. For example, I worked to identify which pieces would be easiest to find/solve for so that we could work more quickly. I also solved many of the equations to ensure accuracy, even though some of them were inaccurate. I also worked to check my partner's work for accuracy, because two eyes are better than one. 


Tuesday, July 19, 2016

Lab 4: Atomic Mass of "Candium"


Purpose: The purpose of this lab was to find the atomic mass of the new element "Candium" (or the candy M&Ms) which has three isotopes (regular M&Ms, peanut M&Ms, and pretzel M&Ms) based off of our measured mass of each isotope, the abundance of each isotope and the average of these numbers.

The average atomic mass that my group calculated was 1.4 amu. 

1. The group across from us had an average atomic mass of 1.76 amu and another group near us had an average atomic mass of 1.3. These are very close to our calculated average atomic mass, but they are not identical. This is most likely because of the numerous variables that could've changed experimental results. For example, the overall abundance of each isotope could've been drastically different than ours and could've swayed results or they happened upon a batch of M&Ms that were larger/smaller in mass.

2. If we had a larger sample size of Candium, the differences between our results would've been smaller. The more samples you have, the smaller your differences will be. Although our sample sizes were large enough that our groups got extremely similar results, if it was larger our results would've been even more similar.

3. If we took a Candium isotope and massed it, it would not have the same mass that we obtained as our average atomic mass. Because our average atomic mass was an average, it is not identical to any of the isotope's average masses. Therefore, any single isotope massed on a balance would not have the same mass as the average atomic mass.

4. Because of the new discovery of Candium, a periodic table square needed to be made. The atomic symbol for Candium is Cd and it's average atomic weight is 1.44 grams. 

Lab 3: Chromatography

Original design
1. It is important for only the wick and not the filter paper circle to make contact with the water because if the water traveled directly through the paper, the water would douse the paper and not flow through it. Because different inks have different physical characteristics, they were able to be moved at different rates through the paper and produce different pigment bands. If the water was left on the paper, the ink would've left the paper simultaneously and would've been washed from the paper, still as a mixture.

2. Several variables that affected the color pattern on the filter paper were the types of pens we used, the thickness of the pen nib, the location of the markings on the paper, the amount of ink on the paper, and the amount of time the paper was left on the wick. 

Wick inserted into the center
3. The ink separated into different pigment bands because of the inks' different physical properties. Some inks had physical properties that allowed them to travel up the filter paper more quickly, creating the bands that were farthest away from their original ink marks. Others had physical properties that made them move more slowly, which made the bands closer to the original ink location. 

4. Blue is present in several of the ink samples. This blue pigment throughout the different ink samples appears to be identical. This specific color of blue appears in all of the samples, which indicates that the pens used and their respective ink contain the same pigment of this shade of blue. 

5. The pens used in this experiment needed to be water-soluble so that the inks could be lifted up by and travel through the water and therefore produce pigment bands on the filter paper. If this experiment was to be done with permanent ink, it would be necessary to use a different medium instead of water in the cup and wick. 

Side view of the wick
and water cup
Final product!


Monday, July 18, 2016

Lab 2: Aluminum Foil Lab

Lab 2: Determining the Thickness of Aluminum Foil


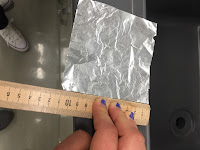
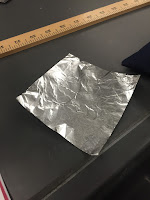
Procedure: The first step we completed was to identify what we needed to measure, which was the thickness of a sheet of aluminum foil. We were given the information that aluminum foil has a density of 2.70 grams/centimeter^3. Next, my group massed the sheet of aluminum foil and found it to be 0.49 grams. Then, we measured the length and width of the aluminum foil and found both the length and width were 10.90 centimeters long. Therefore, we had the information we needed to input into the formula density = mass / volume; density was 2.70 grams/centimeter^3, the mass was 0.49 grams, and the volume was length x width x height, or 10.90 x 10.90 x height. Therefore, the equation would become 2.70 = 0.49 / (10.90 x 10.90 x height). We solved algebraically for the value of the height and found it to be 1.5 x 10^-3 centimeters. Finally, we converted the answer from centimeters into millimeters for a final answer of 1.5 x 10^-2 millimeters.

Data: The final answer we found was that the thickness of aluminum foil is 1.5 x 10^-2 millimeters.


Lab 1: Density Block Lab

Lab 1: Density Block Lab


The block used in the experiment,
which massed 8.3 grams. 
Introduction: My goal in this lab experiment was to figure out the mass (a measure of a plastic block by knowing its density (a substance's mass relative to its volume) and volume (the amount of space that a substance occupies).

Procedure: First, my group identified the variable we needed to solve for (mass) and the information we had been given, which was that the density of the block was 8.3 grams. We knew that we could find the volume of the block and then use the formula density = mass / volume to solve for the missing variable of mass. The volume of the block could be found with the formula length x width x height. Through measurement, we found the length of the block was 2.6 centimeters, the width was 2.6 centimeters, and the height was 2.45 centimeters. Therefore, using this information and the formula, we found the block's volume was 16.562 (16.6 using significant figures) centimeters. Once we plugged this number into the equation along with the density value (8.3=mass/16.562), we found that the mass of the block was equal to 137.4646 grams/centimeter^3, which gave our final answer of 137 grams/centimeter^3 using significant figures.

Data: Our final answer was 137 grams/centimeter^3. The actual mass was 136.9 grams/centimeter^3. Our final percent error came out to be 0.073%.

Conclusion: Our conclusion was that our lab was successful. We found the correct mass on the first try with a less than 1% percent error. Through this experiment, I learned that it is better to use significant figures at the very end of an experiment and to not round off completely for as long as possible before the final answer is found to get the most accurate answer. In the future, I will work on adjusting how and when I use significant figures.